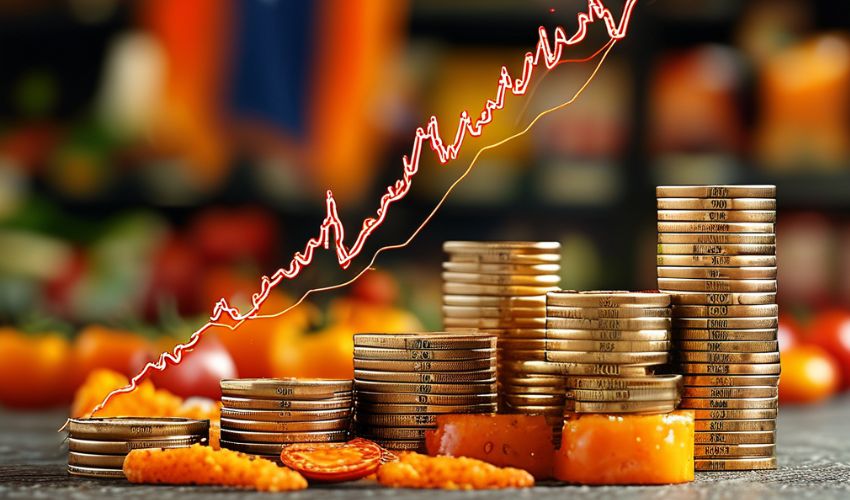
Over the past 16 years, inflation in Pakistan has silently drained household budgets, adding a significant burden to the average grocery bill. Despite government assurances of 'controlled inflation,' everyday essentials tell a different story. Here's a detailed breakdown, backed by data from 2008 to 2024.
Inflation in Pakistan has always been a hot topic, impacting every aspect of daily life. Whether it's your grocery bill or the price of essentials, everything seems to be getting more expensive. Higher inflation means the cost of living goes up, and our money doesn’t stretch as far as it used to.
While official reports might suggest that inflation is under control, the reality on the ground indicates otherwise. The persistent rise in food and utility prices continues to strain the average Pakistani household, making it harder to manage daily expenses.
How trade and import trends affect inflation?
The latest trade summary from the Pakistan Bureau of Statistics (PBS) reveals that in December 2023, the country experienced a trade deficit of approximately PKR 517.9 billion (around USD 1.83 billion). Exports amounted to PKR 799.6 billion (USD 2.82 billion), showing an increase compared to the previous month. However, imports were significantly higher at PKR 1,317.5 billion (USD 4.65 billion).
For the July-December 2023 period, Pakistan's cumulative exports were valued at PKR 4.3 trillion, whereas imports stood at PKR 7.5 trillion, maintaining a notable trade deficit. This imbalance reflects ongoing economic pressures, exacerbated by fluctuating exchange rates and rising global commodity prices.
The depreciation of the Pakistani Rupee against the US Dollar has further inflated import costs, impacting the country’s already strained foreign exchange reserves.
In the meantime, the government's recent measures to stabilize the Pakistani Rupee and reduce fuel costs have had only a marginal effect on overall inflation. Moving forward, there is an urgent need for targeted economic policies to address the urban-rural divide and reduce food prices, which continue to squeeze household budgets.
What happened between 2008 and 2012?
The period from 2008 to 2012 was marked by severe inflation. In the fiscal year 2008-09, inflation reached a staggering 12.35% in July. This increase was driven by multiple factors, including skyrocketing global fuel prices, which trickled down to almost everything else. The prices of basic food items like wheat, sugar, and cooking oil surged by over 20% in some cases.
Food prices on the rise
One of the biggest drivers of inflation over the years has been food. Remember those times when tomatoes or onions suddenly became luxury items? That’s food inflation at work. For example, food prices in urban areas jumped by 3.12% in just one month (August 2019).
This was not just a one-off event. It highlights a pattern where food prices keep spiking due to poor harvests, supply chain issues, and import challenges.
By 2022, the prices of staples like flour, cooking oil, and sugar had surged by 20-30% within six months. As of September 2024, food inflation stands at 11.5% nationwide, with urban areas feeling the most pressure. Despite government efforts like subsidies, Year-on-Year (YoY) inflation for food items remained above 10% throughout 2023. Rural areas saw a slightly lower rate of around 8.5%, highlighting the varying impact across regions.
But it’s not just about food. Core inflation, which excludes food and energy prices, has also been rising. This indicates that even non-food items, like clothing and household goods, are becoming more expensive.
Grocery bills rose 25% in 2 years - Here’s why
Your grocery bill feels higher even when official food inflation is technically low. According to RTI data:
- Food price surge (July-Dec 2022): Staple items like flour, cooking oil, and sugar saw a 20-30% increase within six months.
- Food inflation (Urban Areas, September 2024): 11.5%
- Food inflation (Rural Areas, September 2024): 9.2%
Even with government interventions like subsidies, YoY inflation for food items remained above 10% in urban regions throughout 2023, pushing household budgets to their limits.
Recent Inflation Dynamics (2019-2024)
From 2019 to 2024, inflation has shown clear disparities between urban and rural areas. Official data indicates that people living in cities have been hit harder than those in villages. It means, if you live in a city, you’re probably paying more for the same items than someone in a rural area.
The Consumer Price Index (CPI) data highlights a noticeable disparity between urban and rural inflation rates. In July 2019, the national Month-on-Month (MoM) inflation rate was 1.83%, with urban areas consistently facing higher inflation than rural regions. For instance, urban inflation rose to 8.47% in July 2019, compared to 6.92% in rural areas.
By August 2023, the urban inflation rate further climbed to 12.9%, driven by rising utility costs and fuel prices. In comparison, rural inflation was recorded at 10.5%, reflecting the relative insulation of rural areas from certain economic pressures.
Cities usually have a higher cost of living, so when inflation rises, it’s like a double burden for urban households.
As of September 2024, the inflation rate for food items alone stands at 11.5%, with essentials like rice and vegetables contributing the most.
Hence, the persistent rise in prices not only strains household budgets but also threatens the nation's economic stability. Urgent reforms in trade policies, subsidies, and agricultural support are needed to ease the burden on Pakistani families.
To encapsulate the impact of inflation on the lives of everyday Pakistanis, I'll conclude with a fitting quote:
"Inflation is the silent thief that robs people of their savings, their dreams, and their futures." — Viktor Chernomyrdin
This article uses data obtained via RTI (Right to Information) from various government departments to provide a comprehensive analysis of inflation trends in Pakistan from 2008 to 2024.


